
UPDATE: The Seattle Department of Transportation (SDOT) has now backed away from its previously published Viaduct traffic counts!! The agency now says that it has no idea how many vehicles used the Viaduct in 2012. See our update on Viaduct traffic data—and be advised that this post, and particularly the chart below, are based on data that SDOT no longer supports!
Bertha’s woes are hogging the spotlight. But while everyone’s been looking down, something going on up in the air may prove just as important in the long run: traffic volumes on the Alaskan Way Viaduct have collapsed since the state started its construction project.
Take a look at the trends, courtesy of the Seattle Department of Transportation’s traffic maps: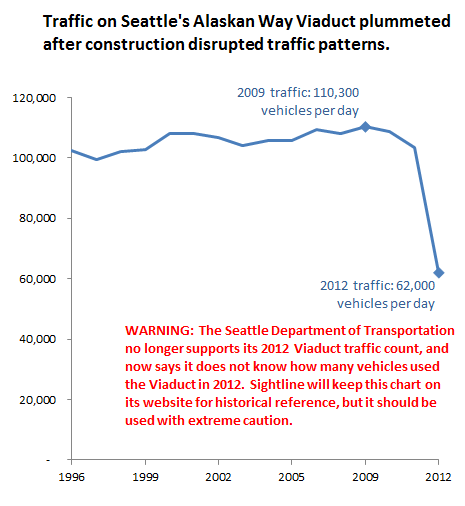
Astonishing! Viaduct traffic fell by 48,000 trips in 3 years—a reduction that, I’m sure, many transportation planners would have thought unthinkable.
Where did the traffic go?
I think there are 4 major reasons that traffic in the corridor has declined:
- A shift from cars to buses. Metro says that bus ridership in the Alaskan Way Viaduct corridor has grown by 33,000 trips per day since the agency added new transit service with mitigation money. That’s a huge increase. Many drivers have parked and jumped on the bus.
- Diversion to surface streets and I-5. According to SDOT, the north-south surface streets west of 5th Avenue added about 6,500 trips in 2012, compared to the prior year. At the same time, WSDOT’s Ramp and Roadways reports show that I-5 added about 4,000 additional car trips per day between 2010 and 2012.
- A long-term decline in car traffic. According to data from SDOT and WSDOT, north-south car traffic through downtown Seattle peaked in 1998 and has been declining gradually ever since. On the Viaduct itself, traffic volumes slid by nearly 7,000 vehicles per day from 2009 through 2011—suggesting that a significant share of the trips that disappeared from the Viaduct in 2012 were part of a longer-term, secular decline in car travel.
- Trips “disappeared” due to traffic delays. When WSDOT tore down the southern end of the Viaduct in last 2011, it created a bottleneck that slowed rush hour Viaduct traffic to a crawl. Faced with those sorts of delays, some drivers may have started to look for other destinations, or consolidated trips to avoid wading through the congestion.
I’m sure that many of the city’s transportation planners are shocked by these numbers. I mean, until SDOT released the Viaduct traffic counts, nobody had even noticed that traffic on the Viaduct had declined by so steeply. There was no fanfare, no outcry from the business community or residents about lost capacity on the Viaduct choking the life out of the city. (Compare that to the hue and cry during the Viaduct debate, when many folks believed that diminishing the corridor’s traffic capacity would bring the city to its knees.)
But there’s a real ray of light here. At this point, nobody knows if Bertha will ever get moving again, let alone complete her job. But given these figures, maybe it doesn’t matter. Seattle has seamlessly adapted to losing the first 48,000 trips on the Viaduct. No one even noticed. No one even noticed that 40 percent of the Viaduct’s traffic just disappeared! Could accommodating the loss of another 62,000 be that hard if we, I don’t know, tried even a little?
Seattle can survive, and even thrive, without a viaduct or a tunnel.
Kate Dee
Clark–
I read this wondering how you can draw these conclusions if you have not experienced the nightmare of North-South commuter traffic in the Seattle area since the viaduct was torn down. I have lived in West Seattle and worked in the Northgate area for 12 years. My commute used to be 25 minutes before the construction detour slammed on everyone’s breaks. The fact is ONLY SO MUCH TRAFFIC can get through the viaduct during rush hour. Cars are completely backed up barely moving through the constricted area. I leave extra early to avoid this in the am and try desperately to leave work early if I can. But I look forward to the day when the tunnel is finished and I don’t have to do that anymore. Many people have adjusted their lives to the snarled situation, but this doesn’t mean that leaving it this way is a logical long-term solution. We need the tunnel now more than ever, and some of us are hoping and praying that they get Bertha moving as soon as possible.
Matt the Engineer
I too have a commute through downtown on 99. I admit for a while it was pretty slow, but it seems about the same now. My commute from QA to SoDo has been a consistent 13 minutes for the past half a year. It’s slower on the way home, and variable, but I found it amazing how commute times didn’t seem to change much. This is reverse induced demand in action. As the time cost of a 99 commute goes up, people choose other ways of getting around until it finds an equilibrium.
Bradon
Well, if you’re looking forward to commuting to downtown via the tunnel, you will be sorely dismayed when you realise that it simply bypasses downtown and deposits all traffic on either the northern or southern end. Don’t believe me? Just look at the plans
http://www.wsdot.wa.gov/Projects/Viaduct/About/Tunneling
There are no planned exits in downtown.
Kathy Johnson
I completely concur with you – I have had this commute for 17 years and it has steadly gotten worse every year. The rapid ride bus lanes are a great idea, but by allowing parking in them during non peak hours has made this substantially worse. I wish the tunnel was done yesterday. I’ve gone from a 17 minute to an average of 35 minute commute in this time span and it is congestion.
Kim SJ
We noticed. We folks over here in West Seattle. Traffic is so choked at rush hour that we have had to adjust work hours in our household, working from home more often than not. If we need to get downtown at 8 a.m.? Better leave at 7. The viaduct, with that huge traffic-choking bend near the stadiums, needs to be fixed pronto. Or we need transportation solutions like light rail or more water taxi service to more docks that don’t rely on streets as the bus system does.
Peggy Abby
Perhaps this Pollyanna piece was just written to engage (or enrage as the case may be) readers about how miss represented these less than actually revealing facts are!
I do not use the viaduct unless there is no better practical way to get to my destination! Many others have decided similarly. Our traffic disaster increases as time wears on!
Downtown Seattle is paying a big price for this amazingly poor design and planning. Its so much easier to shop and do business elsewhere with free parking as well! This will continue and set in as Seattle business will suffer long term! Outlying areas will grow and expand with this push toward them! That may be okay and and a good unintended consequence, at least for them. To be determined later! I am sure!
However your piece is based on very poor observation and weak suppositions! Please invest in deeper investigations and helpful facts!
Anandakos
Madame,
Downtown Seattle retailers can get along just fine without your $2.50 purchases. There are all those wealthy techies just a half mile away in SLU and Belltown. Many more are coming.
Anandakos
Madame,
Did you know that it is possible to end a sentence with a different punctuation mark than the worthy exclamation? There, I used one of the different ways. And there; that’s the other one.
You should try them once in a while. It’s tiring for a reader to have his or her adrenaline zapped with every point.
Anandakos
Ah, my apologies. I do see that three of your twelve sentences are indeed terminated by periods. I couldn’t see the periodic trees in the exclamatory forest.
Josh
Yeah I think we noticed that I-5 went from bad to utterly horrific. I said goodbye to my north-end friends. Which I guess is a sort of “disappeared” trips. Others might call it disappeared livability.
Zach Shaner
I’d love to see this graph with person-throughput included. If transit trips are up 33k and vehicle volumes are down 48k, net loss on the corridor is only 15k. Placing a person-throughput line above the vehicle volume line would help you make your point, nicely showing you the extra capacity that transit wrought out of the same road space.
JB
Why not introduce congestion charging in and around downtown Seattle. It would really smooth out these jams, and other countries that have tried it have found that you don’t need to charge much to keep traffic moving at peak times. Then the free market would send signals about whether and where we really need to add infrastructure.
Mickymse
I’m not sure some West Seattle commenters up above understand that CAPACITY isn’t coming back. When (if?) the tunnel opens, it won’t be built to carry the 100,300 vehicles that were previously there. You’ll either have the current traffic, or you’ll be exiting off onto the street grid Downtown.
Kim SJ
I do understand that the tunnel will not add lanes. But driving it every day you can tell that a major choke point is the hairpin turns by the stadium that occur exactly where traffic from 1st Ave merges on. Terrible design, even for a temporary situation. Straightening the road out and finishing alternative routes should help.
Kathy Johnson
I concur – its a mess at the stadiums
Art
You must be completely gullible! Did you not question these figures? The Fox is in the hen house!
I agree with many of the commentors above.
Things have gotten worse in general. The service levels of other North/South roadways have deteriorated.
And, with the tunnel construction stalled for months, possibly for years or worse not completed, the viaduct needs to be retrofitted right now to reduce the possibility of earthquake damage, which would mean that there would be no transportation corridor through downtown. Dumping all that displaced traffic onto city streets and I-5 would cause TRANSPORTATION ARMAGEDDON, felt all over the region and have sever economic implications.
Stop singing these praises while traffic worsens and risks increase.
Art
Clark Williams-Derry
I haven’t seen numbers on traffic delays. But given the substantial decline in car travel on that corridor, I suspect that you’re right: people are avoiding driving that route because it takes longer than it used to.
What I think is going on: a significant share of the transportation Armageddon you project has *already unfolded.* And while it’s certainly an unpleasant experience for those folks who commute into and through downtown, particularly from the south, the region-wide gridlock and economic implosion really hasn’t shown up in other traffic, employment, or other economic statistics.
Jenn the Transit Engineer
Amazing drop in traffic counts!
It really illustrates the strange behavior of traffic expanding when capacity is available, through-put high, and trips speedy & easy. When the going gets rough, the optional trips are the first to go. Which is what we see with the Viaduct traffic reductions.
The tough part is for the folks who still need to get to jobs, medical care, etc. – the non-optional trips. They are the ones stuck when their trips go from an easy 25 minutes to a miserable hour. It might get better after the tunnel opens, but only if you don’t need to get to downtown, but through downtown.
A similar process is happening with Metro Transit’s service cuts – the optional trips drop significantly and the non-optional get miserable. What does it say about Seattle that we are allowing this to happen?
Wells
=BERTHA CAN BE STOPPED=
=BOX CUT-COVER/SEAWALL=
(FEIS alternative)
Still possible
More stable
No threat to buildings
Manages traffic better
Manages water table flow better
Better utility relocation/access
Better emergency escape/faster
Better Seawall actually necessary
Better spawning & salmonid habitat.
Most important:
Forms solid earthquake barrier
Bertha will shake Pioneer Square into rubble.
Bertha will collapse any vulnerable building
above its entire length. The Seawall replacement
technique -(drill-fill sea-fence)- worsens affects
of underground water softening clay surrounding the
bore tunnel. =BERTHA MUST BE STOPPED=
Nathanael
=BOX CUT-COVER/SEAWALL=
(FEIS alternative)
This made an awful lot of sense and should have been done all along. Because the seawall has to be replaced in any case.
It also had exits downtown, which the Deep Bore Tunnel won’t.
Just make sure you can put a streetcar line on top of it.
Paul Queary
The interesting element left out of this is lost time for the driver/transit rider. I both drive and take the bus from West Seattle to my office in South Lake Union. The bus is ~45 minutes around rush hour, probably 5-10 minutes slower than pre-Viadoom. Driving is 30-45 minutes under normal conditions at rush hour, up to an hour with any kind of a disruption, up from 15-30. So figure an average loss of 15 minutes per day, adds up to 75 minutes or 1.25 hours. Multiply by the number of travelers, and you have a pretty hefty loss of productivity and/or income.
Josh
Note, however, that many people have jobs that allow transit time to be productive work time — my daily hour on transit is half an hour each way for reading and writing with no meetings or phone calls. I could save half an hour driving, but would have to work longer to make up for the loss of productive transit time.
Paul Queary
Wait, my cocktail napkin math is wrong. Everyone has to get home as well, so it’s a round 2.5 hours per week of lost time.
Clark Williams-Derry
Agreed — folks who commute both ways on the Viaduct during rush hour face some pretty steep commute costs. I don’t know if your time estimates are accurate. But as a long-time car commuter myself, I have a lot of sympathy…being stuck in traffic stinks.
Scott Marlow
Since the terrible tunnel, I rarely travel from West Seattle to the north end to visit friends or do anything. That loss of social capital cannot be measured.
I also drive my (50 mpg) motorcycle less because I cannot stop-and-clutch through traffic as my air-cooled engine heats up and my hands cramp.
It’s great for West Seattle businesses because I avoid downtown now as much as possible.
The tunnel has essentially bisected the City – coincidentally, or not – along racial and economic boundaries: the City Council-dominated north end and the poorer, more diverse south end.
Of course traffic *on a poor roadway* is going to decline when other options exist. When they closed the South Park Bridge, traffic did not “disappear” – it was dispersed to other bridges and roads, where it caused more congestion.
Toby Thaler
One of the main tunnel advocates, Richard Conlin, was not “north end.” I don’t consider Burgess and Bagshaw “north end” either. And Rasmussen, Harrell, and Clark certainly aren’t. Nor Conlin’s replacement Sawant. O’Brien is a north ender, but he didn’t like the tunnel. That leaves Licata and Godden. You were saying?
Jon Morgan
We need to toll I-5 — regardless what happens with 99. Tolling rationalizes peoples’ transportation decisions, raises badly needed transportation revenue, and reduces traffic congestion/speeds travel times.
We’ve seen the data on 520; fewer cars are crossing the bridge, transit ridership there is up 25%, and travel speeds have improved. Sure, some of that is due to the lack of tolling across I-90, but the overall situation will get better when it’s finally tolled too. I don’t have a car and regularly go to Bellevue around 520 & 405, originally from Capitol Hill, now from downtown. That trip used to take me about 50 minutes on average, and I always had to pay two fares for the round trip. The ST550 and MT255 took about the same amount of time, though I favored the former. Now, along with added service on the 255 and a restructured Eastside route network, taking 520 is much faster than I-90, my trips in both directions are much faster, and I can make the round trip on a single fare. I can get from my door to the South Kirkland P&R in 20-25 minutes! Taking the 550 to Bellevue TC via I-90 takes almost an hour. The only slow part of Route 255 is I-5 between 520 and downtown.
The 520 tolls are saving me time and money. Let’s do the same thing elsewhere.
Anandakos
You can NOT “toll I-5”. It is an interstate facility which means congestion demand tolling is explicitly forbidden by Congress. The only tolling of interstate facilities allowed is to provide increased capacity or to replace an previously un-tolled structure which requires replacement for one reason or another and then only for the life of the bonds to build the replacement.
Jon Morgan
Yes we can. They do it all over the East Coast and Chicago area. It’s becoming inevitable as gas tax revenue falls. We have no other way to fund necessary maintenance to it.
Rob Norheim
The tollways in the Midwest and on the east coast (and in Orange County CA) were built without federal funding, many of them prior to the Interstate program. They slapped an Interstate marker on them later on. I-5 was built with 90% federal money, and cannot be tolled.
Mark-in-seattle
Myself and fellow posters can pay a congestion monetary toll, but may low-wage workers would shoulder the burden for our reduced travel time convenience. How equitable is that for essential public infrastructure? And if you think $15 per hour (only in Seattle) by 2018 will fix this then I think you need to get out more.
The Twelker/Gray Viaduct retrofit proposal was excellent and very cost effective and might have allowed 1 mile of Alaskan Way along the waterfront to be abandoned then converted to a real waterfront park between Colman Dock and the Seattle Aquarium. Instead Cary Moon gets tree planters and tiny water features beside a 5 lane arterial….nice.
Sean
Is there a breakdown by hour or time of day? I live right next to the viaduct and it almost looks like it is closed at night. A tunnel to carry cars for about 4-5 hours a day seems like a waste. As a former resident of SF, the Embarcadero has traffic on game days, but increased ferry and streetcar service has helped. A tow-away lane in the new SF waterfront boulevard helps with capacity while providing some parking off-peak. Bus only lanes would have faster travel times while basically advertising transit to the other car lanes.
Also, I think there is a boost to downtown businesses in the evening as a lot of people stick around until the peak dies down.
Mary Ann Schroeder
How much has our population grown in the years
covered by the graph?
Also, I live in Greenwood and work in Wedgwood. The freeway is in between these two neighborhood’s.
I think the distance between the two in probably
two miles as the crow flys. But taking a bus to work means a transfer and it’s never less
than an hour. If I ride my bike it’s a bit less but
All I mean to say is if you’re coming all the way
from West Seattle it’s not surprising it takes so long.