
Today is the beginning of Diwali—one of the most important events in the Hindu calendar—and that seems like a decent reason to take a look at a new facet of the Northwest’s demographic makeup.
The world’s largest Hindu country, India, has added a substantial share of its people to some Northwest cities. Bellevue has far and away the highest number of Indian people in the state, though nearby Redmond claims the top spot on percentage basis.
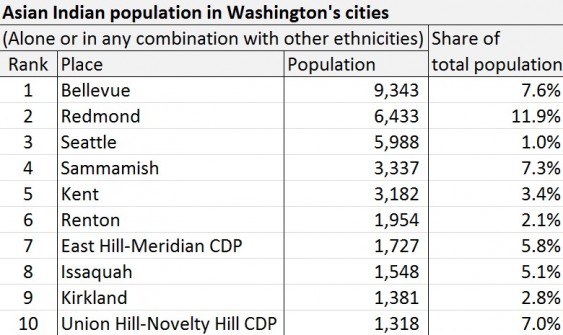
Both have more in absolute numbers than the much bigger city of Seattle.
A quick word about the numbers. Theses figures come from the 2010 Census and refer to people who self-identify as either “Asian Indian alone” or “Asian Indian in combination with some other ethnicity” in official parlance.
Interestingly, every single one of Washington’s top cities for people of Indian descent is in King County and in particular, the high-tech cities of Seattle’s eastern suburbs—Bellevue, Redmond, Sammamish, Issaquah, Kirkland, and Union Hill-Novelty Hill—are home to a remarkable share of residents who identify as Indian. South King County rounds out the mix.
In Oregon, the population of Indian people is distributed differently .
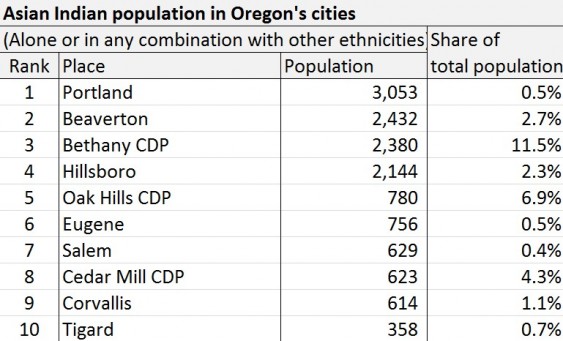

The center city of Portland claims the highest number with west-side suburbs—Beaverton, Bethany, Hillsboro, Oak Hills, Cedar Mill, and Tigard—taking most of the other top spots. Other large cities in the Willamette Valley—Eugene, Salem, Corvallis—pick up the remaining spots.
Idaho has comparatively few people of Asian Indian heritage. Boise is the only place there with a sizeable number, 1,175, making up 0.6 percent of that city’s total population.
By contrast, British Columbia has far more people of Indian descent than either Oregon or Washington. Canadian demographic statistics are very different from US numbers however, so the figures are not comparable. Still:
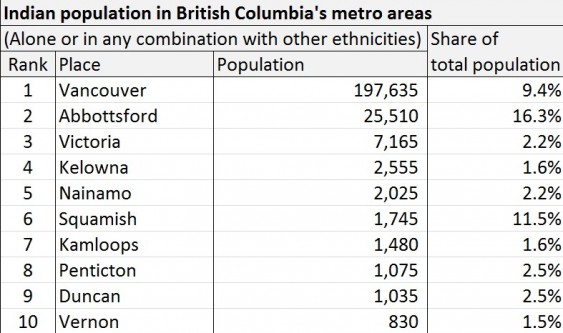

A couple of big differences to call attention to right away. First, the table here refers to metropolitan areas, not cities.
Second, Canada’s census uses very different classifications for ethnic categories. To produce the table above—as roughly comparable as I could make it—I had to make calculations based on some debatable assumptions. I included people who self-identified as wholly or partially Bengali, East Indian, Goan, Gujarati, Kashmiri, Punjabi, or Tamil. (Noting, of course, that the home regions of Bengalis, Kashmiris, Punjabis, and Tamils include large swaths of territory outside of India.) If I had included only people who self-identified as East Indian, the population numbers would be about 10 percent lower.
Likely a legacy immigration between nations of the British Commonwealth, the Vancouver metro region is home to nearly 200,000 people of Indian ancestry who make up almost 10 percent of the total population there. Other population centers in southwestern BC—Abbotsford, Victoria, Nainamo, Squamish, Duncan—rank highly with a strong showing by cities on Okanagan Lake in southeastern BC—Kelowna, Penticton, and Vernon.
Sources: Data for US from the US Census Bureau, “Profile of General Population and Housing Characteristics: 2010,” 2010 Census Summary File 1. Data for Canada from Statcan, “Ethnic Origin (247), Single and Multiple Ethnic Origin Responses (3) and Sex (3) for the Population of Canada, Provinces, Territories, Census Metropolitan Areas and Census Agglomerations,” 2006 Census – 20% Sample Data.


Tenzin
Do you have an updated data for Asian Indians in Oregon?
Kelsey Hamlin
The data presented here comes from the 2010 US Census, which was the last and most recent time the Census took place. There will be another census in 2020, however!