
I think you can officially call this a pattern: traffic volumes all around the Pacific Northwest are falling short of the projections made just a few years ago. Take a look at just a sampling of the evidence:
- The Golden Ears Bridge: Both traffic volumes and tolling revenue on this new bridge outside of Vancouver, BC are falling short of expectations, adding up to “a cumulative shortfall of $63.8 million since 2009 for a bridge that was supposed to pay itself off in 30 years,” according to the Maple Ridge Times.
- The Columbia River Crossing project: According to this analysis by Portland economist Joe Cortright, the number of cars taking the I-5 bridge between Portland, OR and Vancouver, WA “has declined every year after 2005.” The trends are almost the exact opposite of the transportation modelers’ predictions: “Traffic levels in the nearly five years since CRC forecasts were completed have declined by about 7,000 vehicles per day, rather than increasing by about 7,000 vehicles per day as forecast.”
- Seattle: According to a recent Seattle Times story, “the Seattle Department of Transportation…found traffic dropping from 920,000 average daily trips within city limits for 2008 (and 975,000 trips in 2003) to 900,000 trips in 2009.” This is roughly the same story we heard last year (see Publicola for news coverage, and the SDOT website for traffic maps). Of course, the numbers are a bit old now, and may be tied up in the effects of the recession.
- Portland: In greater Portland, OR, vehicle travel measured per person peaked in 1996, and has fallen by about 12 percent since then.
- Washington highways: From 1983 through 2000, total vehicle travel in the state had typically increased in the range of 2.5 to 6.5 percent per year—i.e., a lot. But after 2000, vehicle travel started growing much more slowly; and then it cratered in 2008, when gas prices soared and the economy soured. As a result, traffic volumes on state highways were lower in 2009 than in 2002. (See p. 47 of this pdf from WSDOT—but note that a change in methods may have affected the reported traffic between 2003 and 2004.)
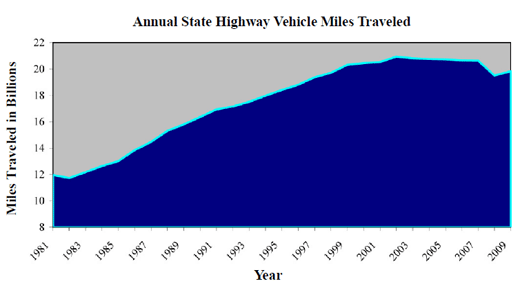
- Oregon highway system: In Oregon, traffic volumes—not just per person, but total miles logged on highways—peaked in 2002. VMTs fell slightly from 2002 through 2007, and then fell sharply in 2008. (See the chart below.)

What’s especially interesting to me about many of these trends is that traffic started to level out before the phenomenal spikes in fuel prices in 2007 and 2008.
As the finance industry is careful to point out, past performance is no guarantee of future results. But it certainly seems to me that there’s mounting evidence that, without quite realizing it, we’ve just lived through a sea change in Northwesterners’ appetite for car travel. What seemed like an inexorable rise in vehicle travel has turned, for the moment at least, into somewhere between a choppy plateau and a slow decline.
I expect that there are many reasons for the recent trends: high gas prices, economic uncertainties, demographic shifts, and (perhaps) an increase in people’s preferences for car-lite lifestyles. Regardless of the reasons, though, it may be time for transportation planners to begin adjusting their expectations. Sure, we’re still a very car-dependent culture, and we’re likely to remain so for many years. But it may not make sense anymore—and might, in fact, be financially risky—for transportation planners to assume that demand for car travel will rise in the future the way it did in the 1950s.


Nathan
Great find! It may be interesting to compare some of these stats to amount spent on highway/roadway construction, statewide population as well as levels (hours spent within, perhaps?) of congestion, etc, etc, to see if there are other reasons or explanations why vehicle travel is hitting a ceiling.
Charles
How do these numbers relate to rates of mass transit use, bike riding and walking? Also, how do they relate to population densities in urban areas vs. rural and suburban areas? If alternative forms of transportation are being used more over the same periods in the same places, and the population is moving into urban areas more over the same periods, THEN I think we have an interesting trend. Without those data, I think this idea is open to a bunch of whole punching by the leaders of the War by Cars.
SteveG
I think this is just starting. There are all kinds of new transportation technologies that will accelerate this trend, including next-generation car-sharing (check out http://www.getaround.com to see where it’s headed…), bike-sharing, dynamic tolling, dynamic ridesharing apps (www.avego.com), etc.The important question right now is whether our leaders will seize the moment and push these new approaches, or cling to the dying “ever more asphalt” paradigm that highway engineers, roadbuilders, construction trade unions and their representatives in Olympia/Salem, Washington DC are all desperate to hold on to.I hope the CRC’s relentless backers are reading this. But I’m not optimistic…
Stacey W-H
This is a moment to celebrate! Great story Clark! It’s so nice to have a bit of positive news.Perhaps transportation planners will now begin looking at the future we *want* rather than the future the past tells us we should expect.
Gord Price
Clarke, you’re definitely on to something. And it’s not just North America:http://pricetags.wordpress.com/2011/02/25/how-could-they-get-it-so-wrong/ ONE of Queensland’s largest initial public offerings, Rivercity Motorway (which operates Brisbane’s Clem Jones tunnel*) has collapsed, owing $1.3 billion. …Rivercity’s initial traffic forecasts predicted the road would carry 60,000 vehicles a day and that this could increase to 100,000 within 18 months. But traffic volumes are closer to 20,000 vehicles, despite initial moves to discount the toll by as much as 50 per cent to encourage motorists.
Clark Williams-Derry
Gord – That’s truly an amazing find. Do you know of other examples outside of North America??Nathan – good questions about time. It’s actually pretty hard to get reliable data on total time spent in cars, by region. I may try to check out the National Household Travel Survey numbers, to see if there’s a long-term trend. Congestion figures are a mess—there’s a time series from the Texas Transportation Institute, but I simply don’t trust it anymore.Charles – I agree that census numbers could help explain the trends, but I still feel like the numbers are meaningful (and surprising, at least to me) all on their own.
Rev Twowheeler
Great news! The young and new immigrants no longer expect to have to own a car. Commuting can be by transit/foot (much better for podcast listening and reading anyway) or bike, and weekend trips can be zipcar’d.With data like this, politicians have no excuse not to spend taxpayer funds on better infrastructure, infrastructure that keeps cash in the local economy, rather than sending it to Alberta and Michigan.
Barry
In Vancouver BC public transit is seeing the opposite trend. The new “Canada Line” light rail hit full capacity years ahead of projections. Express buses are absolutely jam-packed during commute hours. Walking, cycling and car share increasing.Gasoline sales in the city keep falling year after year.A combo of density and alternative modes of transit are clear winners up here.Also agree with twowheeler comment that younger generation is less interested in car ownership. Car companies are worried about the trend. Seems “generation hot” is looking for alternatives.
ml johnstone
exacberating how these figures get usedthey NEVER include the FULL costs of transportationcongestion,noise,hospital care, emergency response,police surveillanc e, stress from traffic,more pavement, parking lots,filthy streets, street cleaning, road repair, etc etcfast food joints,wall to wall malls.obesity,diabetes,etc etc etc
Virginia Bruce
I know a ton of folks who work at home full or part-time. That has to have something to do with this.
GP
Ding, ding, ding – we have a winner!
That has a huge effect. I meet more and more professional people every day who either work from home 1-2 days/week or are permanently home-officed. Certainly gas prices have caused some of the change, but technology and acceptance of working at home as a legitimate option have pushed it higher and higher.
Andrew Eisenberg
Also, you forgot to mention that these numbers are declining *despite* rising population across the whole region. So, per capita decline in VMT is actually larger than the chart above reflects.
Gordon Price
ClarkAustralia has had a bad run on tunnels. In Sydney, Lane Cove – “The ‘failed infrastructure project’ has been a disaster for the company, which went into receivership in January 2010 after a string of losses.” And the Cross City Tunnel – “As of December 2006, the tollway was insolvent with debts of over AU$500 million.”But the larger story is the incremental decline in traffic. Mark from Victoria commented on my blog:Nothing focuses the mind like $60 (and climbing) fill-up costs. Interestingly here in Victoria we set 2026 targets for non-auto mode share that were reached in 2006. With 46% of all city journey to work trips by either walking, cycling or transit, we are now tied with Montreal for the highest “sustainable” mode share in Canada (2006 census). Using places like Copenhagen as benchmarks of best practice we should aspire to meet now meet the A and the R of the SMART objective test.
Jim Lazar
We should not necessarily assume that a decline in traffic during a recession will be permanent. The graphic above excludes the two oil embargoes, and the gas price run-up that came with them. VMT declined in 1974 and in 1978-79 as well. Of course things can go the other way as well. Washington enacted the “variable” percentage (not cents per gallon) gas tax in 1979, and then the price collapsed in 1980, leading to a fiscal crisis for WSDOT. We all hope this is the beginning of a big trend. But it might be a recession-driven inflection. Of course, the recession might be the first couple years of a depression as easily.
Curtis
This phenomenon is not limited to traffic projections. Another good example of chronic over-projection can be found in water supply. For the last few decades, water supply forecasts have always predicted an upward trend in water demand, but each forecast consistently over-predicted future demand because water use efficiency was not accounted for properly. More recent water demand forecasts do account for some additional improvements in efficiency, but I think there is still a tendency for these forecasts to always predict some increase in demand (or traffic) – perhaps stable for sometime into the future with an upward turn at the edge of the planning horizon? I suspect that is because ultimately this is the way these utilities justify new construction projects that keep them in the black. For water utilities you can easily imagine that as costs go up, but demand for their product goes down…well there is a problem. In the transportation sector it would be the decline in gas tax revenue. Honestly, what’s the incentive for these utilities to seriously invest in demand reduction?
Clark Williams-Derry
Jim -I generally agree—the future is hard to predict. That said, the Oregon chart says (to me at least) that the VMT trends predate the recession, predate the oil price runups, predate the plateau in housing prices, etc., etc. It’s hard to know what that means for the future, but it’s also hard to say that the trends are just recession-driven.Curtis -That’s a great analogy!! Do you happen to have any references on water consumption you can share??
Daniel Henderson
I’d have to see it plotted against 1) gas prices, 2) unemployment rates, and 3) alternative transportation to make any judgment on it.
Curtis
Clark,The most recent regional water supply planning effort website should have the most up to date information on historic water demand trends and future projections – http://www.govlink.org/regional-water-planning/Curtis
Byron
Behold the rise of telecommuting!