
Over the past few days, I’ve been trying to pull together some data on how airplane travel affects global warming, as part of a broader project on transportation and climate change.
My stunningly obvious conclusion: it’s complicated. Worse, different calculation methods yield wildly different results.
Take, for instance, this brilliant chart (below) from the Stockholm Environment Institute, comparing many of the major online emissions calculators. Emissions are represented by the light blue lines. As you can see, the online calculators find that a Boston-DC round trip has the impact of somewhere between .19 tons and .48 tons of CO2 emissions, depending on which calculator you use. (By the way—as I discuss below, it looks like the Atmosfair calculator is probably the most accurate and comprehensive.)
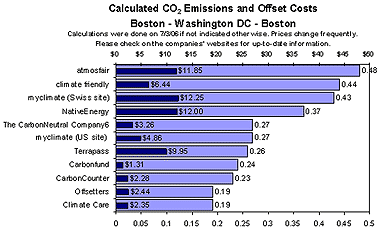  |
The high-end estimate is over two and a half times higher than the low-end estimate. What’s up with that?
To be brief, the complications in calculating air travel emissions include:
- Distance of flight. Generally speaking, short flights use more fuel per mile traveled. It takes a lot of fuel to lift a plane, and shorter flights have more lift per mile traveled. Taxiing also burns through fuel, and the amount of taxiing doesn’t vary that much by the length of the flight. So you can think of short flights as “city” driving for a car—with lots of idling and acceleration—and long flights as “highway” driving. That said, fuel efficiency drops for very long flights, since the plane has to carry extra fuel for a long flight—and it takes fuel to carry fuel.
- Altitude. Although long flights tend to use less fuel per mile, they also tend to fly higher, and stay at high altitudes for longer. And high-altitude flying has some troubling side effects. On net, airplane contrails, and the cirrus clouds they form at high altitudes, are believed to trap heat in the atmosphere, especially at night.
- Timing and location. Flying at night, and at northern latitudes, may increase the formation of heat-trapping clouds. During the day, though, clouds may reflect sunlight back into outer space.
The problem is, there’s tons of uncertainty about all of these effects, particularly for hgh-altitude emissions. (See this IPCC report, especially this page, for more on this.) But on average, the IPCC recommends multiplying the CO2 emissions from fossil fuels by 2.7 to get the total global-warming impacts from a given flight. That is, the comprehensive global warming impacts (counting contrails, clouds, and trace gases) of flying are about 2.7 times as high as the CO2 alone. Note, however, that according to this pdf, a more recent study pegs that figure at 1.9, rather than 2.7.
Confused? I certainly am.
As should be obvious, these complications can make it really difficult to estimate the climate impacts of any given flight. And to add to the confusion, if you really want to be accurate you’ll need to account for the type of plane you’re flying, how old it is, whether you’re flying first-class or economy (first class seats take more room on the plane), and how full the plane is. Sheesh!! It makes calculating the climate impacts of your car a piece of cake!
There are two ways around these complications. First, you can make some simplifying assumptions—some rules of thumb that work pretty well, all things considered. And second, you can rely on the best, most reliable online calculator you can find.
For the second tack, the Stockholm Environment Institute recommends Atmosfair, since it has the broadest and most comprehensive assessment of the climate impacts of flying—covering not just CO2 emissions, but also other gases, contrails, and the like. As a consequence, Atmosfair tends to give a higher estimate of climate impacts than the other flight calculators—depressing, but probably pretty accurate.
For the first tack—well, any rule of thumb is going to be overly simplistic. But for my purposes, it may be best to stick with the CO2 releases from airplane fuel only, divided by short, medium, and long-distance flights. World Resources Institute issued some widely used estimates, based on a 2005 report by a British government agency, that have been used at this reputable GHG protocol site. However, The British agency updated its figures in a 2007 report, here, allegedly based on this EU report (though I can’t figure out how.) So I’m going to use the most recent British figures (see table 6 in the pdf) as the best available estimate of CO2 releases per passenger-mile. Converting from metric, they’re:
- .56 pounds per mile for short flights,
- .46 pounds per mile for medium flights, and
- .37 pounds per mile for long flights.
Of course, that doesn’t match up at all with Atmosfair’s results. But it’ll have to do for now. I’m done with complexity.


Matt the Engineer
“Taxiing also burns through fuel” I wonder how much. If this is significant, maybe it’s worth solving the problem. I’m envisioning an electric car that hooks up to an airplane, and engages when the airplane lands and disengages and goes back to charge once the airplane reaches the runway. Everything but the engaging manouver could be automatic (to save cost of hiring hundreds of drivers), and the engaging manouver could be handled remotely.
Matt the Engineer
(I’ll withhold suggesting aircraft-carrier-style cable launching devices for now, as there are probably structural reasons why this is a bad idea)
Clark Williams-Derry
Matt—I’ve seen something like that proposed: basically, a tugboat for taxiing aircraft. If I find a reference, I’ll try to append it to this post.Wait, here’s US patent info for something like this (maybe not electric, but you get the drift).
Dan
Aircraft also alter the daily temperature range, which provides some signals to plants for germination and senescence.
Matt the Engineer
Clark,”Fuel Consumption [while idling]: 3200 lbs/hr/aircraft” That certainly sounds like a problem worth solving.
Alan Durning
In the old days (like 25 years ago), airports used specialized vehicles to push airplanes to the gates. I’m guessing they were much more efficient than running the wheels off of jet engines.Anyone else remember them?Of course, they only handled the final parking stage, not the taxi-ing.
Matt the Engineer
Cool, an electric version of aircraft tow trucks exists. Not only that, but they’re Oregon based.Alan, I’ve definately seen aircraft tow trucks in action, but I don’t know if they’re only used at certain airports or if they’re mostly used for moving around disabled airplanes. I haven’t seen them completely replace jet engine taxiing.
ajscholz
Regarding the emissions associated with taxiing aircraft, check out this initiative from Virgin’s chairman Richard Branson.
barry
I always enjoy your detailed numbers research, Clark. On this one perhaps you are missing the forest for the trees. It doesn’t matter what “number” you come up with from all the various reports. Because there isn’t any number that is sustainable or survivable. There is no IPCC emissions scenario that is sustainable that can be met if people keep flying at all. Monbiot in Heat does the math as do many other groups and scientists. So until anyone anywhere comes up with way for high-speed air travel to continue for even a couple more decades, the only question is how soon we will kick our habit and leave some emissions room for things like agriculture, power, shipping, industry and so on.Also flying has lots of multiplying factors that make it much worse. There are the IPCC documented ones (i’ve read the report and lots more in detail):* NOx & Ozone which equals CO2 in warming* Carbon soot* Vapour trails* Cloud formation* Water vapourBut there are also the less obvious ones:* Ease and speed of emissions* Siren call to non-flying people to join inThe “ease and speed” is a huge multiplier. I can’t think of any human invention in history that allows individuals to produces as many climate-changing emissions as quickly and easily as airplanes. The speed of flight makes it *far more likely* for emissions happen and to happen in vastly greater quantities. Imagine driving cross-country for a quick weekend conference or trip to DisneyWorld. Not going to happen. Flying enables unbelievable emission excesses…that other transport modes don’t. You can not compare emissions from flying and driving or train or bus. It is a totally false comparison because it is unrealistic in terms of time and likelihood.The “siren call” is likewise huge additional “forcing”. As everyone is realizing, the race for survival of climate change will be lost of China and India and other emerging economies start to adopt our current high-emission G8 lifestyles. The longer we keep flying the more they will join. The more we advertise “big important lives need to include flying” the more people will get on planes. Everyone is important in their own minds. This can’t be emphasized enough. There is no technology even hinted at by anyone that allows high-speed air travel to continue. That is because their is no fossil fuel alternative in quantities needed. The only possible solution would be bio-diesel and the airline industry admitted that to even supply 10% of USA current air fuel would take a land mass the size of Florida. People have traveled and lived amazing and rich lives long before flying. Most of the world still has never flown. It can’t be an essential ingredient to enjoyable life. However if any significant portion of the non-flying world takes it up…there will be very little hope for an enjoyable life.Just because the additional forcings are hard to quantify doesn’t mean they aren’t present and wrecking havoc. Finally, in your end comparison, if you include flying at all, it would be good to tell a typical story. For example the average American family of 4 flying on vacation vs. driving. If you include the IPCC forcings and ignore the “ease and speed” forcings you will see that flying equals driving same distance in a 2 to 5 mpg vehicle. Of course, as i’ve pointed out, people would not do that nearly as often or as far if they had to drive.
barry
Clark, here are some more air travels thoughtsstats:* EXCELLENT REFERENCE REPORT: Here is a very detailed and readable report by the European Federation for Transport and Environment on the “myths” of aviation climate change impacts. Massively footnoted. Very highly recommended. It shows when you add up all the factors, “aviation performs three to ten times worse in terms of climate impact than cars on competing distances.” They do an excellent job quantifying the “time and ease” factor. They highlight the inequality of flying emissions: “It’s the rich that fly, even in this era of low-cost carriers—if aviation paid its true costs we could help the poor a lot more.” Also plenty of interesting facts such as modern jets are no more efficient than 1950’s Lockheed Constellation for example. Of the dozens of such reports i’ve read, this is the best. http://www.climnet.org/EUenergy/aviation/2006-06_aviation_clearing_the_air_myths_reality.pdf* AIRLINES HAVE EXACT INFO: It occurs to me that the airlines all know the exact CO2/passenger-mile for every flight going back for years. They keep records on:1) fuel consumed on each flight2) number of passengers3) miles flown. Fuel use per passenger mile is one of the essential numbers in maintaining profitability. They have the data. But it is very hard to get publicly. Why? Even Kyoto exempted tracking and reporting of it. * PRIVATE & CORPORATE JETS ARE BIG PART OF EMISSIONS PICTURE. The National Air Traffic Controllers Association has great stats on what planes are in the air each day. http://www.natca.org/mediacenter/bythenumbers.msp . Of the 87,000 flights each day in USA: 28,000 are commercial flights 27,000 are private planes 24,000 are charter flights 5,000 are military 2,000 air cargoThere is a huge increase in private/personal/corporate small jet travel. An article in LA Times recently highlights this emissions trend in aviation: “Of particular concern is the rapid expansion of corporate and private jet travel. ‘The math is simple,’ Air Transport Assn. President James May testified before Congress this year. ‘Carrying 250 people and cargo across the country in a single plane burns a lot less fuel than over 30 separate corporate jets, each flying six people.’ ” Might be interesting to add a fourth category to your list of emissions per mile for the massive private plane reality. * YOU CAN LIMIT YOUR EMISSIONS. Most ticketing places let you see what kind of plane you will be flying on…and whether it is direct flight or not. The difference in fuel per mile is huge for different aircraft. There is a very public relations battle between short-haul and long-haul airlines in EU about this very point. It would be great to have a consumer cheat sheet for this info much like the sustainable seafood sheets that eco groups do for buying fish. Best of all would be a law requiring labeling of CO2 per passenger-mile for flights when you are choosing which to take. People who continue to fly for pleasure should at the very least try to minimize their impact via simple step of choosing efficient aircraft. It’s no different than going into car rental agency and choosing an appropriate car for cross-country trip….except the impact is far, far larger.
Clark Williams-Derry
Barry – Thanks, I’ll take a look!! I think there’s actually pretty good data on CO2 from aircraft. Maybe not perfect, but good enough for a ballpark estimate. And as far as I can tell, the CO2 impact from flying is a quite a bit lower, mile for mile, than for driving solo. Of course, a 2 hour plane flight still consumes WAY more fuel than a 2 hour drive—so the “fuel per mile” figure obscures the fact that plane trips are long, and therefore much more damaging than you might think. I think that’s a flaw in the chart—but I also decided, after testing it on some random people, that a chart without any accounting of air travel is incomplete and confusing, and immediately raises the question of how air travel compares.And as you correctly point out, CO2 isn’t the only issue for air travel. Not by a long shot. By most estimates I’ve seen, the comprehensive climate impacts of air travel are 2-3 times greater than CO2 impacts alone. For our charts, we went “upstream” for all travel impacts for precisely this reason—if we didn’t include the extended, life-cycle impacts of flying, we’d understate how damaging it can be. Still, as far as I can tell there’s still quite a bit of debate about the precise magnitude of contrail effects, cirrus seeding, etc. As far as I can tell, Atmosfair’s calculator did the best of any of the online calculators at looking carefully at emissions per mile of travel; but there’s no guarantee at all that they’re accurate.
Steve Walker
I have lived a pretty long life so far and the world needs to address this problem further. I’ve seen documentaries on TV boasting of the air travel industry as how global is has become, yet we continue to ignore that fact that thousands of planes are in the air on a daily basis and the millions of gallons of fuel being used by the air lines doesn’t seem to ruffle any feathers. Perhaps the hotel/motel industry needs to bring suit against the air travel industry to persuade travel to get back to auto travel. With fuel reaching such high prices perhaps the air industry should have to pay 3 to 4 times more for fuel and raise ticket prices to 3 to 4 times higher. When it becomes something that a person will be serious about having to pay $3,000 to $4,000 dollars for a ticket then people will look for more economical travel alternatives. It really isn’t just a problem of economics rather a problem of global impact. How come there isn’t any serious senate impact studies being looked into about this further. I currently have a license as an A&P in the aviation industry and I can tell you it really has become a serious problem since the aviation industry began from the 1940’s to now. It seems to just be something everyone wants to ignore since it will impact everyone’s ability to get from point A to point B in a quick manner. Our children and grand-children will have to deal with this if they are able to survive the impact of what we are doing to our planet.